How To Create Engaging Infographics

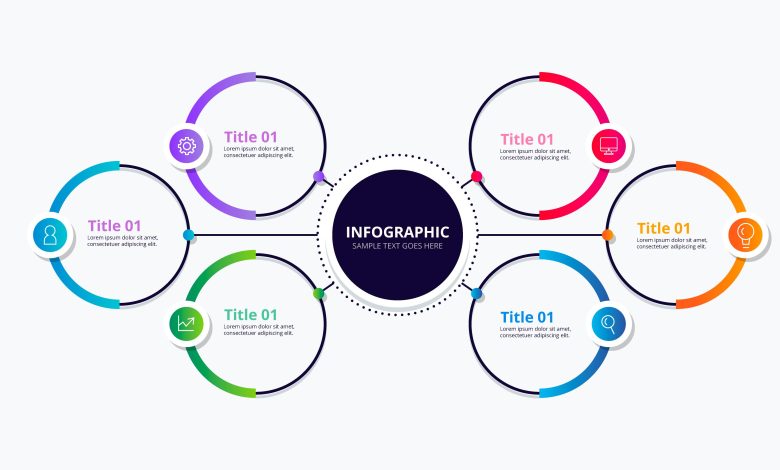
Infographics is an information-packed visual art that helps readers understand the information quickly. Let us discuss how we can create good infographics for our blog posts, social media posts, or emails. You may already know about the famous Canva tool. It’s excellent for creating social media posts conveniently. But the premium version is more amazing. You can use the Canva coupon code to grab hot deals to save money.
Understand the Power of Infographics:
Before we dive into the creative process, let’s explore why infographics are such a compelling communication tool:
Visual Appeal:
Infographics use visual elements like images, icons, and colors to make data more engaging and memorable.
Simplifies Complex Information:
They break down complex data or concepts into easily digestible chunks, making them accessible to a broader audience.
Boosts Retention:
People tend to remember information better when it’s presented visually. Infographics enhance retention and understanding.
Define Your Purpose and Audience:
Every infographic serves a specific purpose and caters to a particular audience. Start by defining these:
Purpose:
Are you trying to explain a process, present statistics, compare options, or tell a story? Clearly define the purpose of your infographic.
Audience:
Consider who will be viewing your infographic. Are they experts in the field or complete beginners? Tailor your content and design to your audience’s level of understanding.
Gather Your Data and Information
The heart of any infographic is the data and information it conveys. Here’s how to gather and organize your content:
Research:
Collect accurate and reliable data from reputable sources. Ensure that your information is up-to-date.
Organize:
Arrange your data logically. Create an outline or a storyboard to determine the flow and structure of your infographic.
Select the Right Tools
You don’t need advanced design software to create infographics. There are user-friendly tools available for beginners:
Canva:
A web-based graphic design tool with various templates and drag-and-drop features.
Venngage:
Designed specifically for creating infographics, it offers customizable templates.
Piktochart:
It is an easy-to-use tool with pre-made templates and a user-friendly interface.
8. Create Engaging Visuals
Visual elements are the backbone of any infographic. Here’s how to make them impactful:
Icons and Images:
Use high-quality icons and images that relate to your content. And make sure that they resonate with the content.
Charts and Graphs:
If you’re presenting data, choose the right type of chart or graph (e.g., bar charts, pie charts) to illustrate your point effectively.
Consistency:
Maintain visual consistency in terms of style, color, and typography throughout the infographic.
Focus on Readability and Flow
Your infographic should be easy to read and follow. Pay attention to these aspects. Keep the dimensions of your infographic in check. It should be readable on both desktop and mobile devices. Ensure a logical flow from one section to the next. Use arrows or visual cues to guide the reader’s eye. Maintain consistent spacing between elements and avoid overcrowding.
10. Review and Test
Before finalizing your infographic, review it carefully. Double-check all data and information for accuracy. Proofread the text to eliminate errors. If possible, get feedback from a sample audience to ensure your infographic effectively communicates its message.
Conclusion:
Remember, creating infographics is a skill that improves with practice. The more you practice, the more you’ll get better over time. Use the Canva tool or other favorite tool to create infographics daily. Ensure all the content you add should be sorted, such as H1 and subheadings. They shouldn’t confuse readers. Infographics take time to create, but it’s totally worth it as we interpret images faster than words. At the same time, it may be hard to create infographics the first time. But practicing it daily will make you an expert.


